

Interactive graphics maker
Make interactive graphics people can explore.
Turn static diagrams, custom maps, infographics, and product visuals into clickable website embeds where every part of the picture explains itself.
Free forever plan · No credit card · Works in Wix, Webflow, WordPress, Shopify, Squarespace
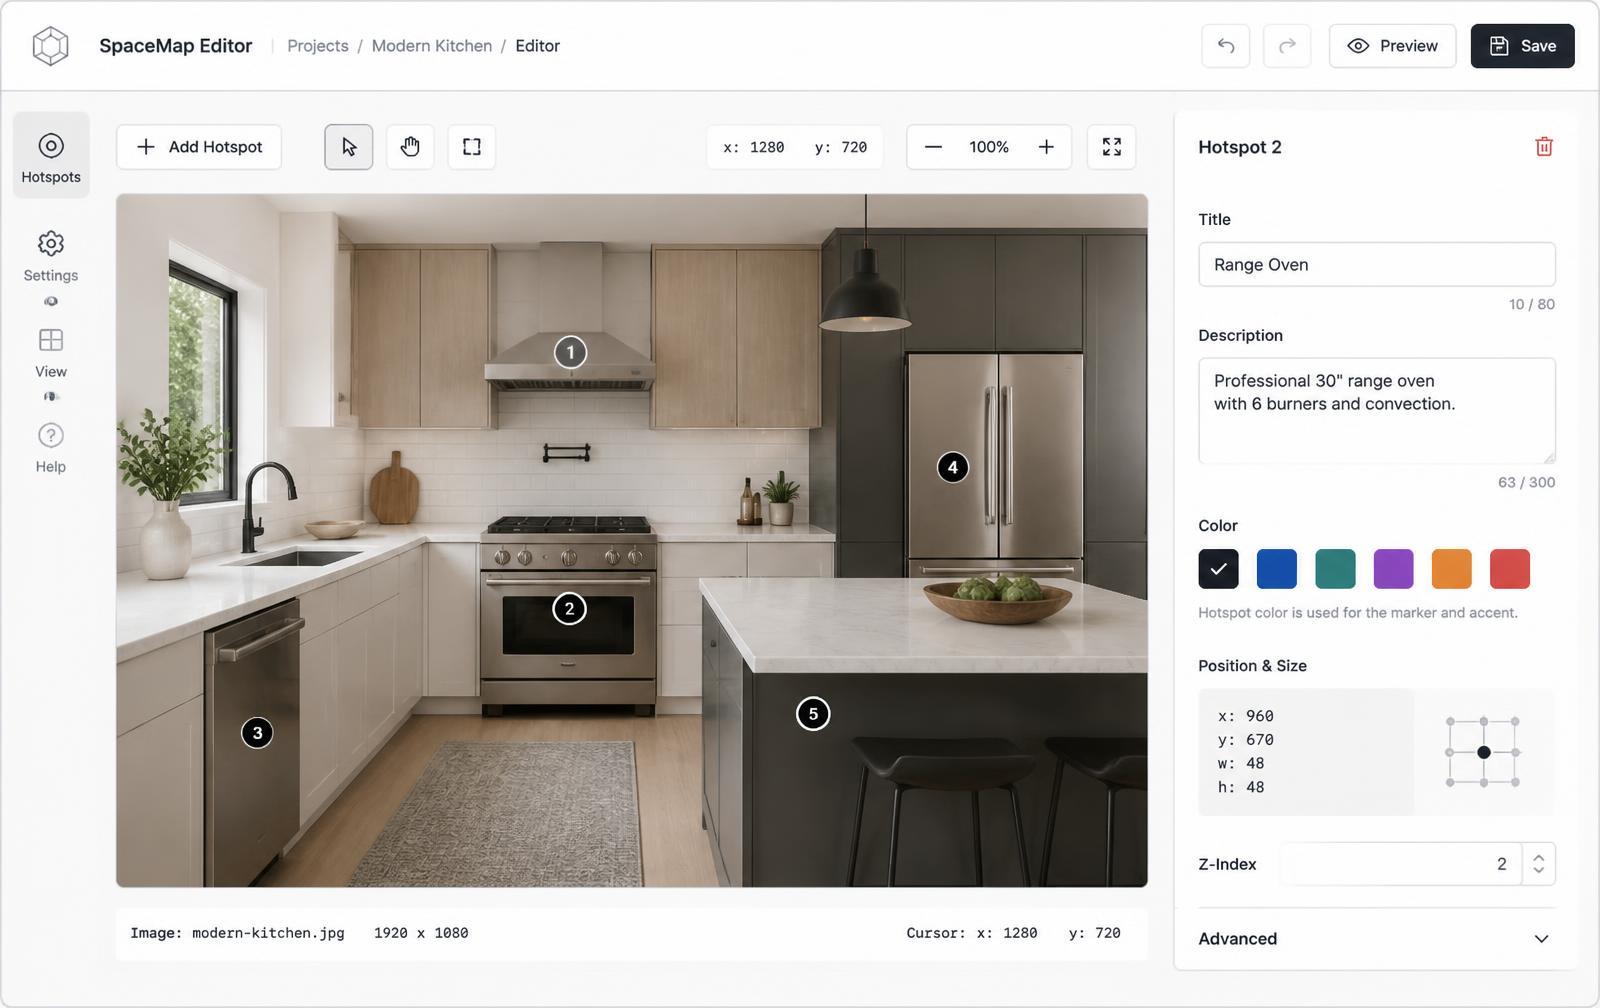
Built for visual explainers
Add context directly to the exact part of the graphic a visitor is inspecting.
Media-rich cards
Use text, images, video, and CTA buttons inside each hotspot popup.
Embed anywhere
Publish one responsive iframe for Wix, Webflow, WordPress, Shopify, Squarespace, and custom sites.
What you get
- Interactive infographics and data graphics
- Clickable product and parts diagrams
- Custom interactive maps — territories, networks, campuses, stores
- Explorable floor plans and site plans
- Training, onboarding, and documentation graphics
- Sales enablement visuals your team can update without a designer
When to use an interactive graphic
Use one when the visual carries more detail than a single caption can explain, and when your audience cares about different parts of it. Product teams use them for feature tours, manufacturers for labelled diagrams, analysts for annotated charts, and marketers to make a dense landing-page graphic scannable.
The difference from a normal image is that each part answers a specific question right where the visitor is looking — instead of a legend they have to cross-reference, or six stacked crops with arrows drawn on them.
Try one
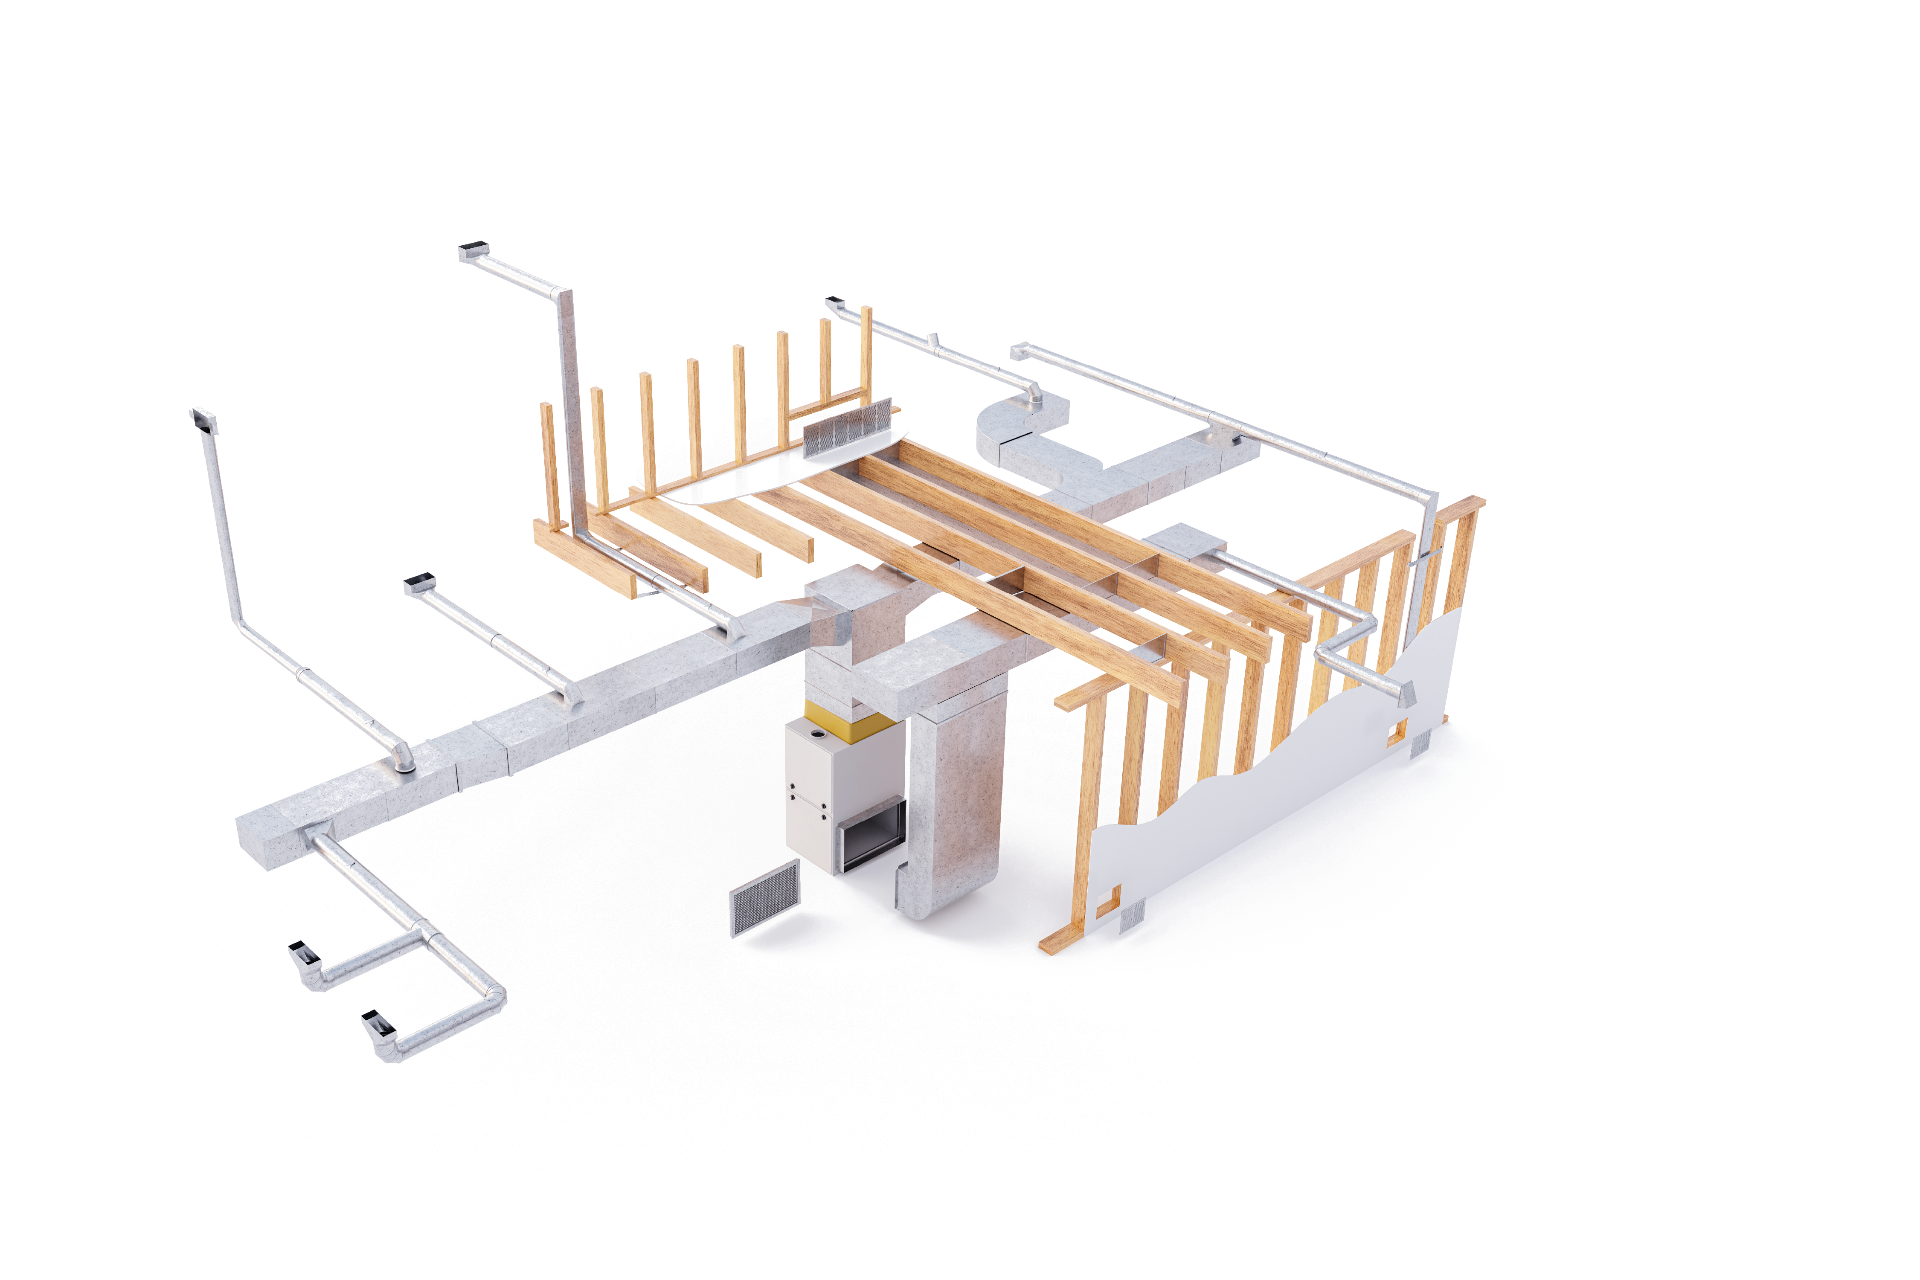
Hover or keyboard-focus the markers. That is what the editor produces, with your graphic and your copy.
Four steps from a flat export
- Finish the graphic first. This is not a design tool — export from Figma, Illustrator, Canva, PowerPoint, or your charting library at 1600–2000px on the long edge.
- Place the markers. Click each area you want to explain, then drag to fine-tune.
- Write short cards. A title and two lines beats a paragraph. Detail belongs behind the CTA.
- Paste the iframe. One snippet, and later edits propagate to every page hosting it.
Custom interactive maps that aren't geographic
A lot of people searching for a "custom interactive map" don't want Google Maps with pins — they want their own artwork to be clickable. Because the base is just an image, that is the same job as any other graphic:
- Illustrated territory and coverage maps for sales and service areas
- Network topology and architecture diagrams with per-node detail
- Store, mall, and exhibition layouts with tenant or booth information
- Campus and site plans — see the interactive map maker page for map-specific guidance
- Fantasy, game, and event maps where the artwork is the point
Interactive charts and data graphics
Charting libraries give you tooltips on data points but nothing for the narrative: why the line dips in Q3, what the methodology was, where the data came from. Exporting the chart and hotspotting the moments that need explaining is often faster than rebuilding it as a live component, and it survives being embedded on a page you don't control.
Put the source link in the CTA of the hotspot that makes the strongest claim. Attribution buys credibility, and it is the first thing a sceptical reader looks for.
Designing the graphic so hotspots work
- Leave breathing room. Every area you plan to hotspot needs clear space for a marker. Dense artwork with no gaps fights the dots.
- Drop the baked-in labels. If a hotspot card will say it, don't also print it on the image — you are paying for it twice and the graphic gets busier.
- Watch marker contrast. A dark dot disappears on dark artwork. Marker colour and size are settings, so pick them against your actual image.
- Cap the count. Roughly 40–50 markers is the readability ceiling on one image. Beyond that, split it or group markers into colour-coded categories.
- Prefer landscape-ish shapes. Very tall graphics produce very tall iframes that sit awkwardly in most page layouts.
Why not build it in code?
You can, and if you only need a few links, percentage-positioned anchors over an image are about fifteen lines — the markup walkthrough covers it. The case for an embed is everything after launch: cards with media, editing copy without a deploy, and one source of truth across every page and platform. And if you have ever had hotspots slide off a graphic on a phone, the alignment explainer is why.
Frequently asked questions
Do I need design software?
No. Create the visual anywhere, then upload the finished image to Interactive Image and add the interactive layer in the browser.
Will the hotspots stay aligned on mobile?
Yes. Hotspots are positioned as percentages of the image, so they stay attached to the right part of the graphic as it scales.
Can I animate the graphic?
Markers pulse to signal interactivity, but the base image is static. For motion, embed a short video inside the relevant hotspot card rather than animating the whole graphic.
Can more than one person edit a graphic?
Editing is tied to the account that owns the image, so teams typically share one account for shared graphics. Anyone can view an embed without signing in.
What file formats can I upload?
PNG, JPEG, and WebP. Export vector artwork to PNG at around 1600–2000px on the long edge — PNG keeps flat colours and thin lines crisp.
Turn any image into a guided experience.
Free forever plan. Paste one iframe into your site and ship.
Create your interactive image